I am a prolific tweeter. At the time of writing this blog post, I’ve been on Twitter for a little under 6 years. In those 2,187 days, I’ve tweeted 22,417 times. (That’s an average of 10.25 tweets every day, or about a tweet every 2.5 hours).
If we estimate the average tweet takes about 30 seconds to post, I’ve spent more than 11,000 minutes – almost 8 days – just creating tweets.
That’s a lot. And that’s before you even think about the time spent reading other people’s tweets.
I’m fascinated by these numbers, and not just because of the enormity of the time sink dedicated to this social media vanity project. No, my fascination lies in the patterns.
I look at the fact I spent 672540 seconds creating this content, and I end up with lots of questions. Question like:
- How do I use Twitter?
- What do I tweet about?
- When do I tweet?
- How does it change over time?
I can rest easy though, because the answers are at hand. Thanks to Twitter’s archive export tool, and my slowly increasing knowledge the R statistics package, I haz grafs. Here’s what I learnt from my first deep dive into my Twitter archive.
I love Wednesdays
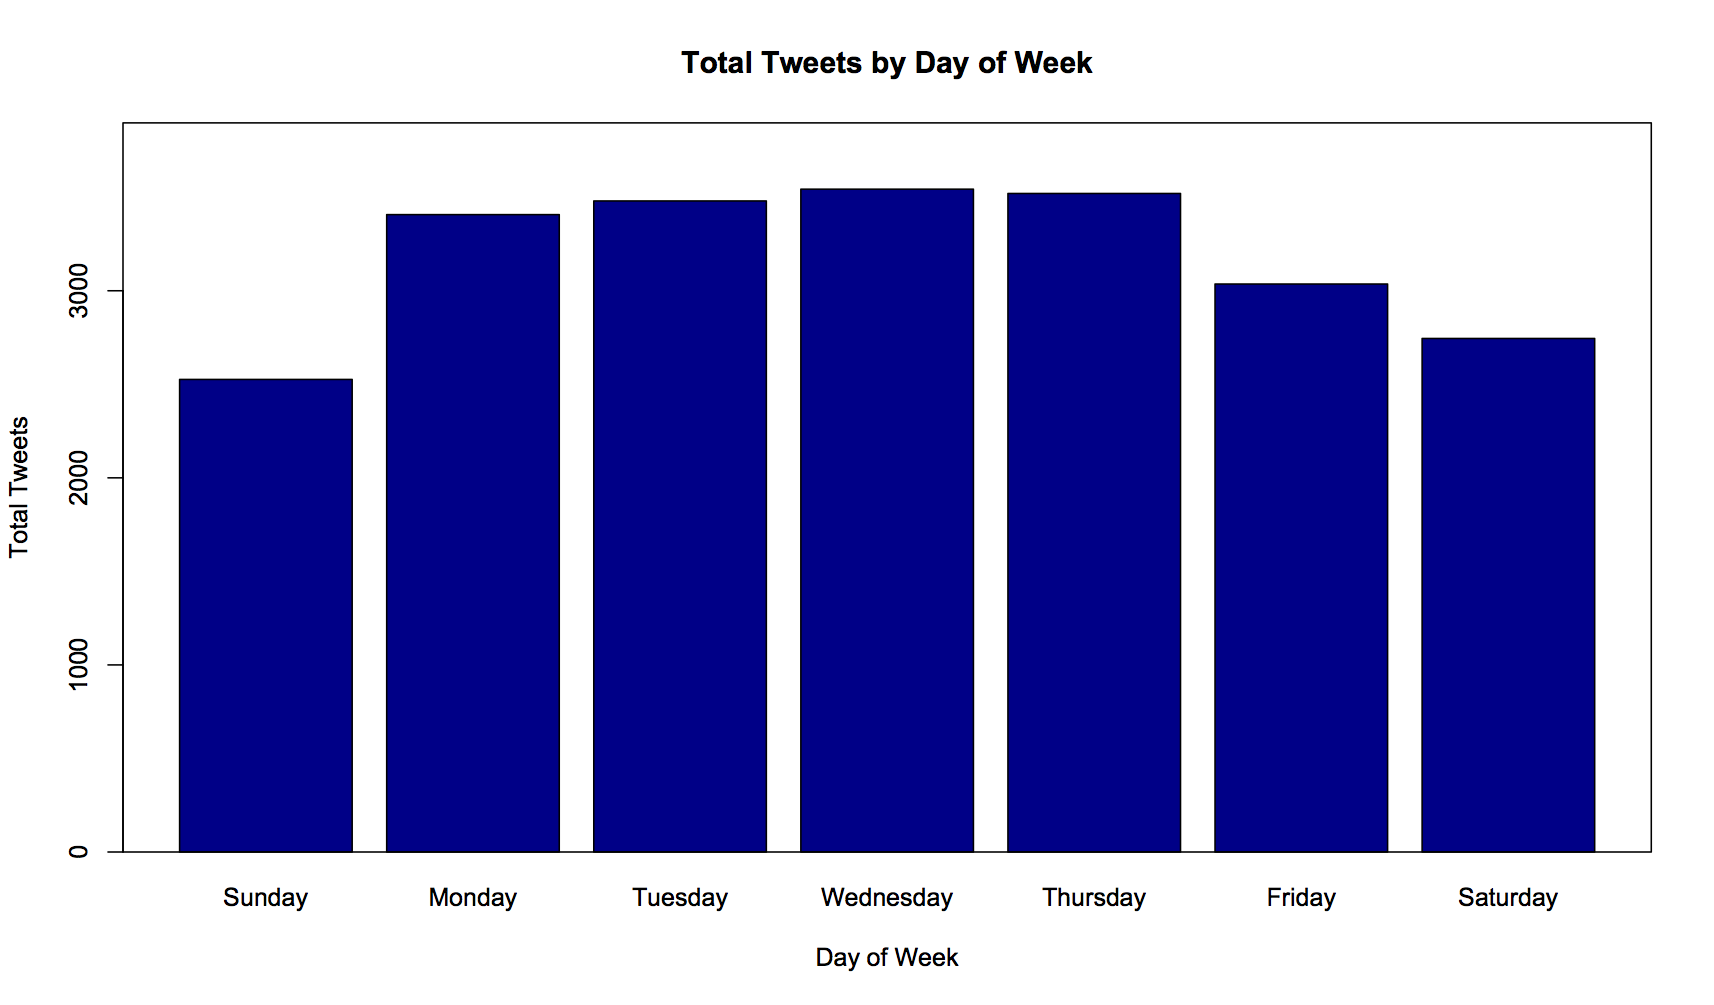
I had an feeling that, given I’m normally less frantically busy at the weekends, I might be most prolifically tweeting on Saturdays and Sundays. Not so, according to this graph. Apparently, I love tweeting on Wednesdays.
Real-world holidays are Twitter holidays
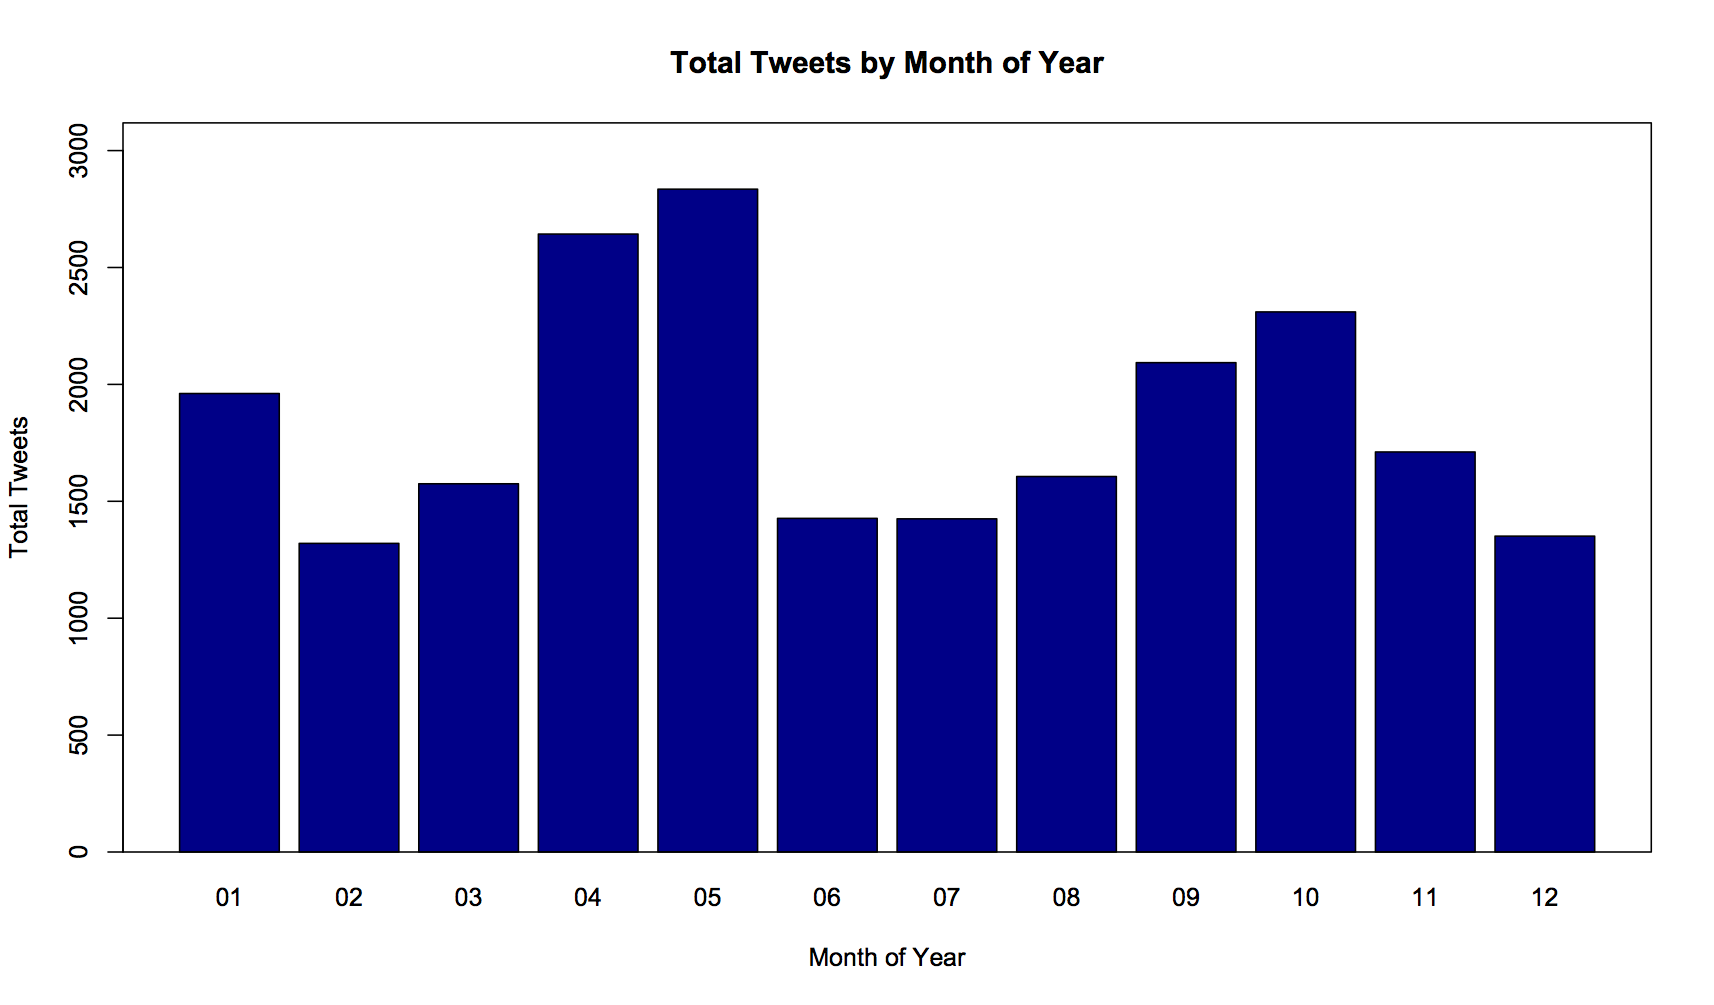
The total tweets I have done by month are seemingly a similar case as days of the week. For 5 of the last 6 years I’ve been studying, and bound by a scholastic timetable. Each of the dips here roughly line up with a period of holiday – between college or university terms.
Just as I spend more time tweeting when I’m busy during the week, it looks like I spend more time tweeting when I’m at college or university. What might explain the large number of tweets in May and October though?
I tweet more during periods when I’m stressed
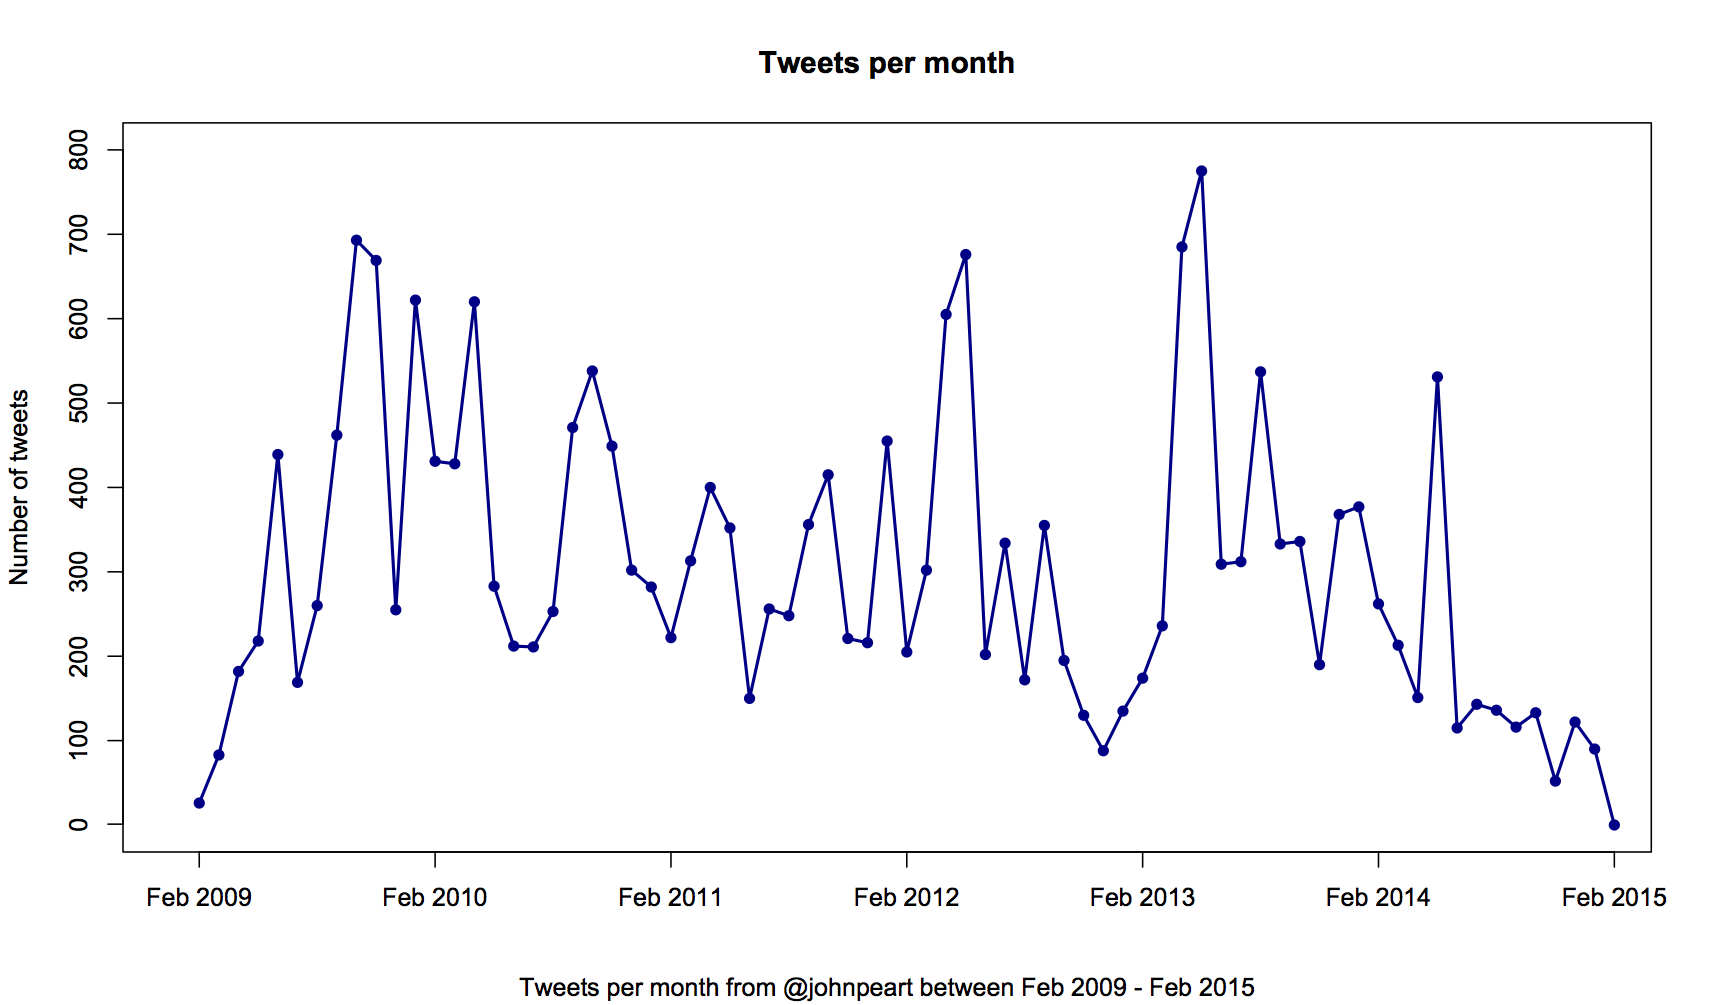
My tweeting, month-on-month, varies wildly. Some months I tweet an average of 25 times every day; others, I tweet less than 4 times a day. The interesting thing for the data between 2010 – 2013, is the upticks in tweets each year in April and May.
From August 2010, to August 2013, I was studying at LSE. April and May consistently see a huge uplift in the volume of tweets, which immediately crashes down in June, and bounces back up in July. One plausible explanation? Exams.
April and May would be the point at which revision mode kicks in. June and very early July was the exam period itself. The data is somewhat counter-intuitive though. It’s ironic that in April and May, at a time when I should have been concentrating on getting things into my head, I would spend so much time getting things out of it. Conversely, at a time when I would have been doing the opposite, writing reams of paper, I tweeted far, far less.
I use every character Twitter can give me
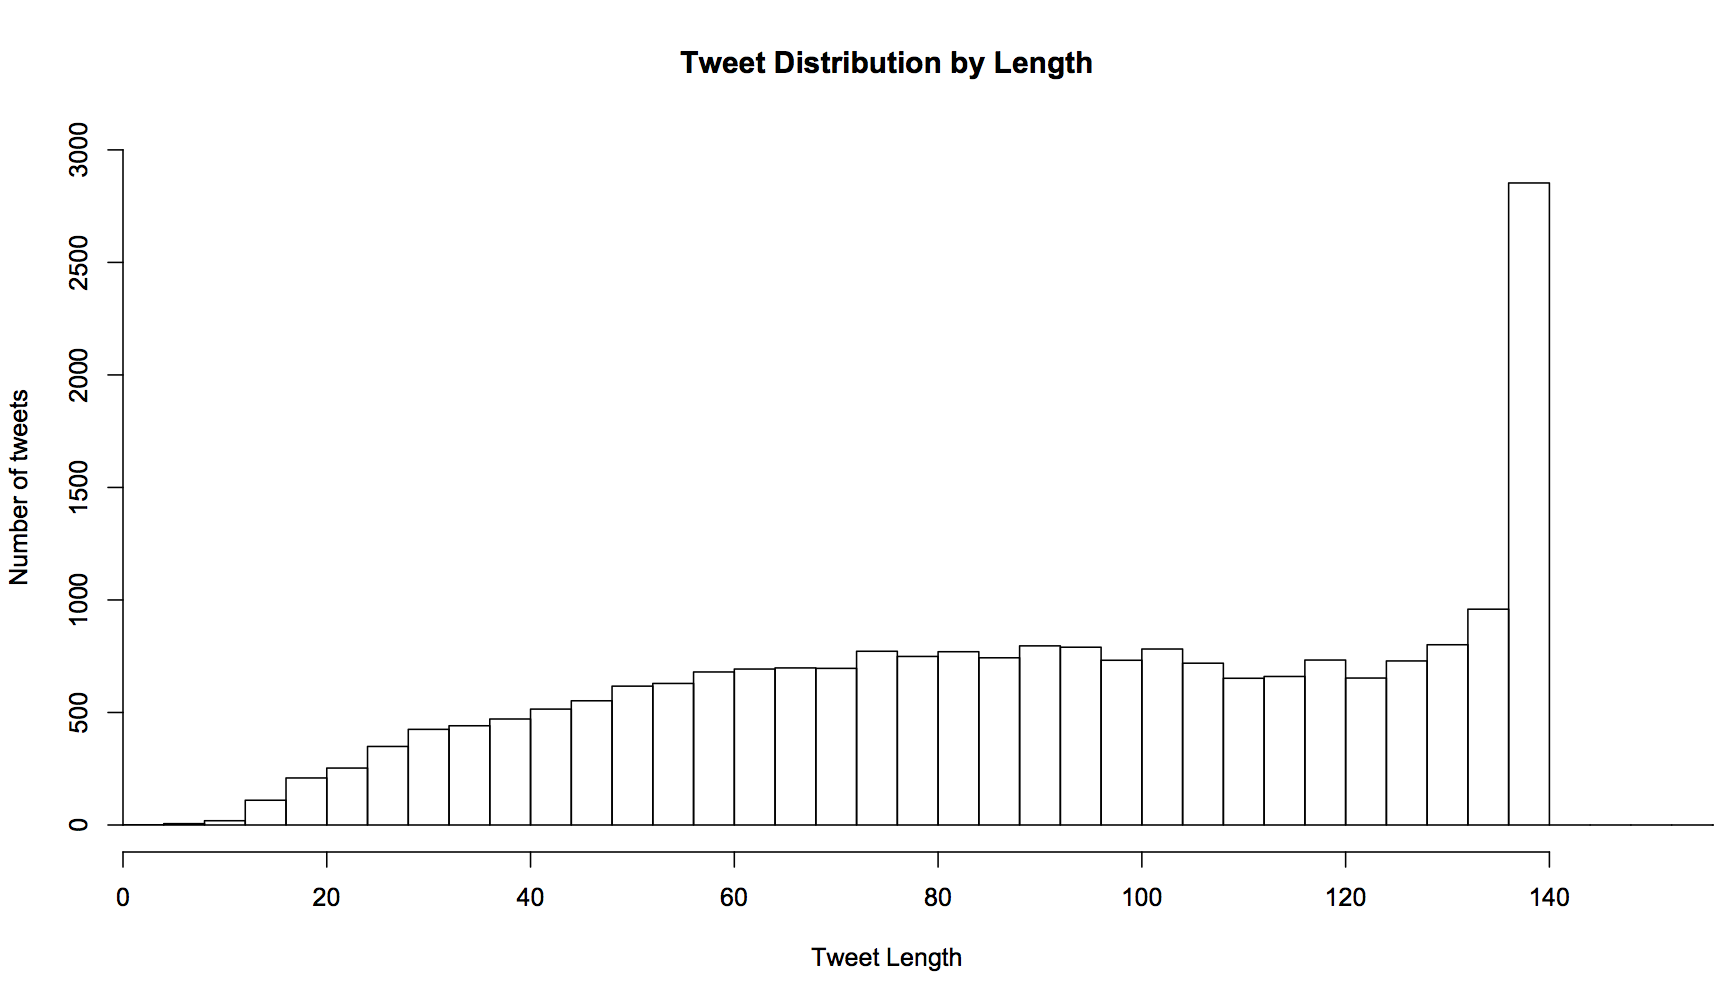
We all know that Twitter has a 140 character limit on a Tweet. And more often than not, it looks like I use every last available character. I guess I’m just greedy.
That I have some favourite Tweeple I mention
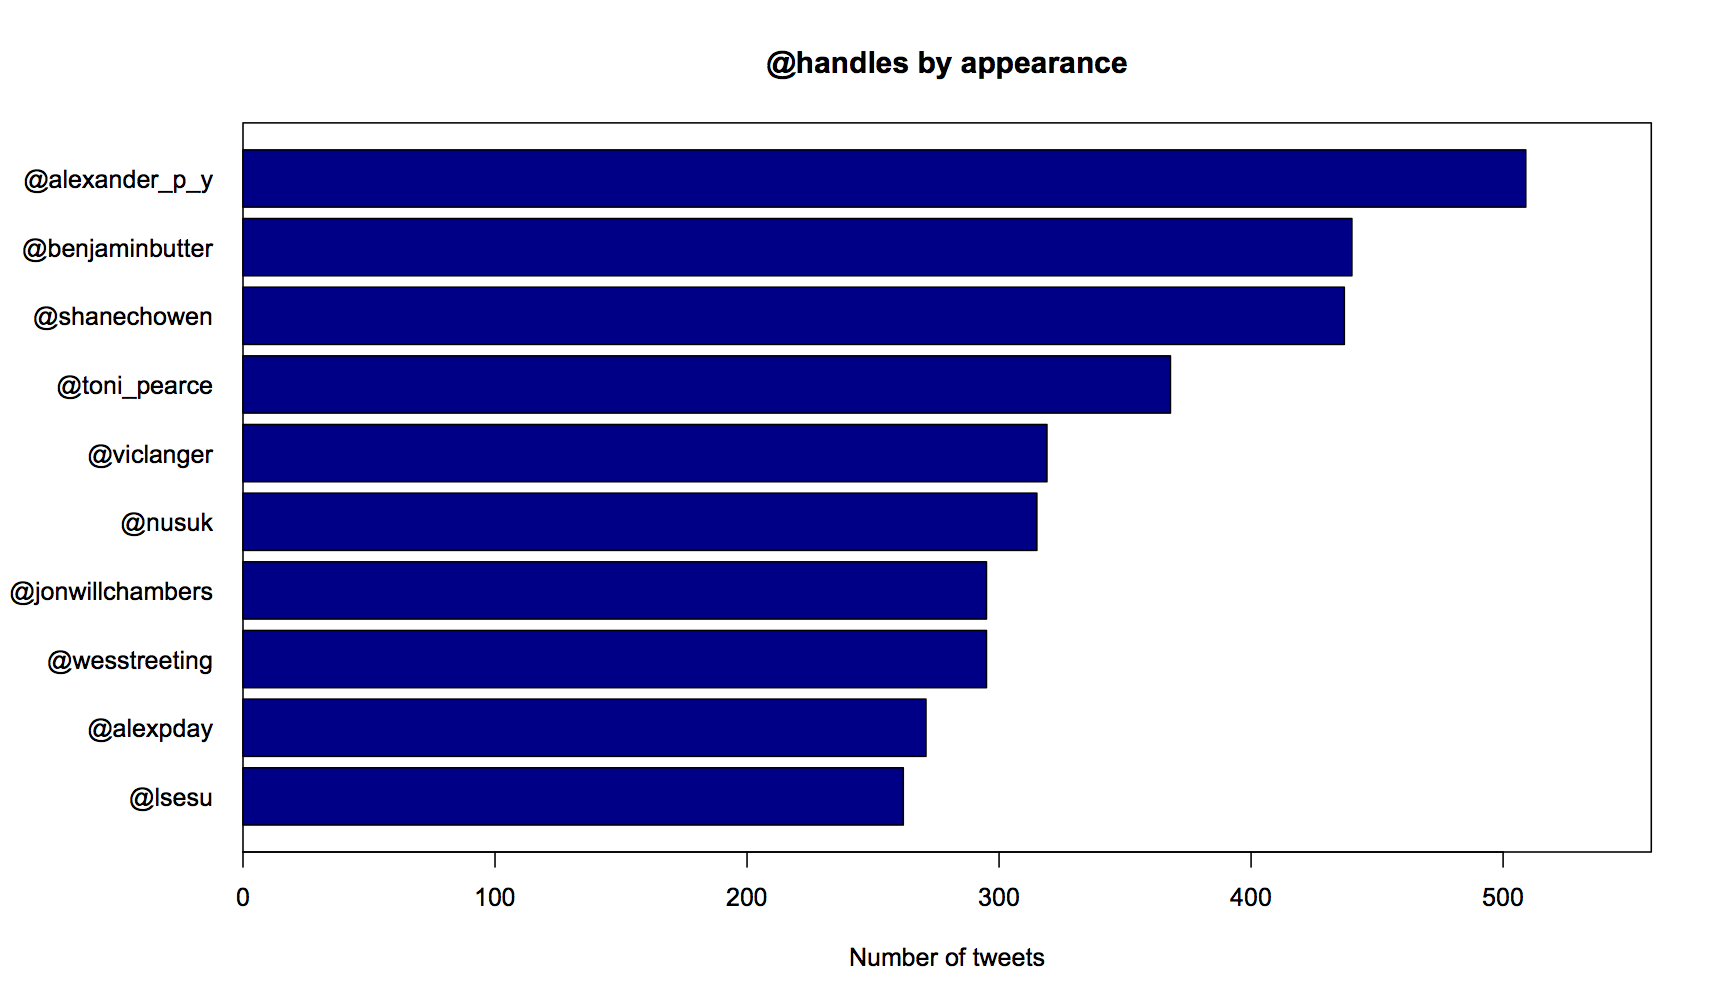
This graph shows the most popular handles that appear in my Tweets; the most frequent @mentions.
Alexander Young, Benjamin Butterworth and Shane Chowen; it looks like you get most of my Twitter time.
I tweet on topics that are utterly predictable
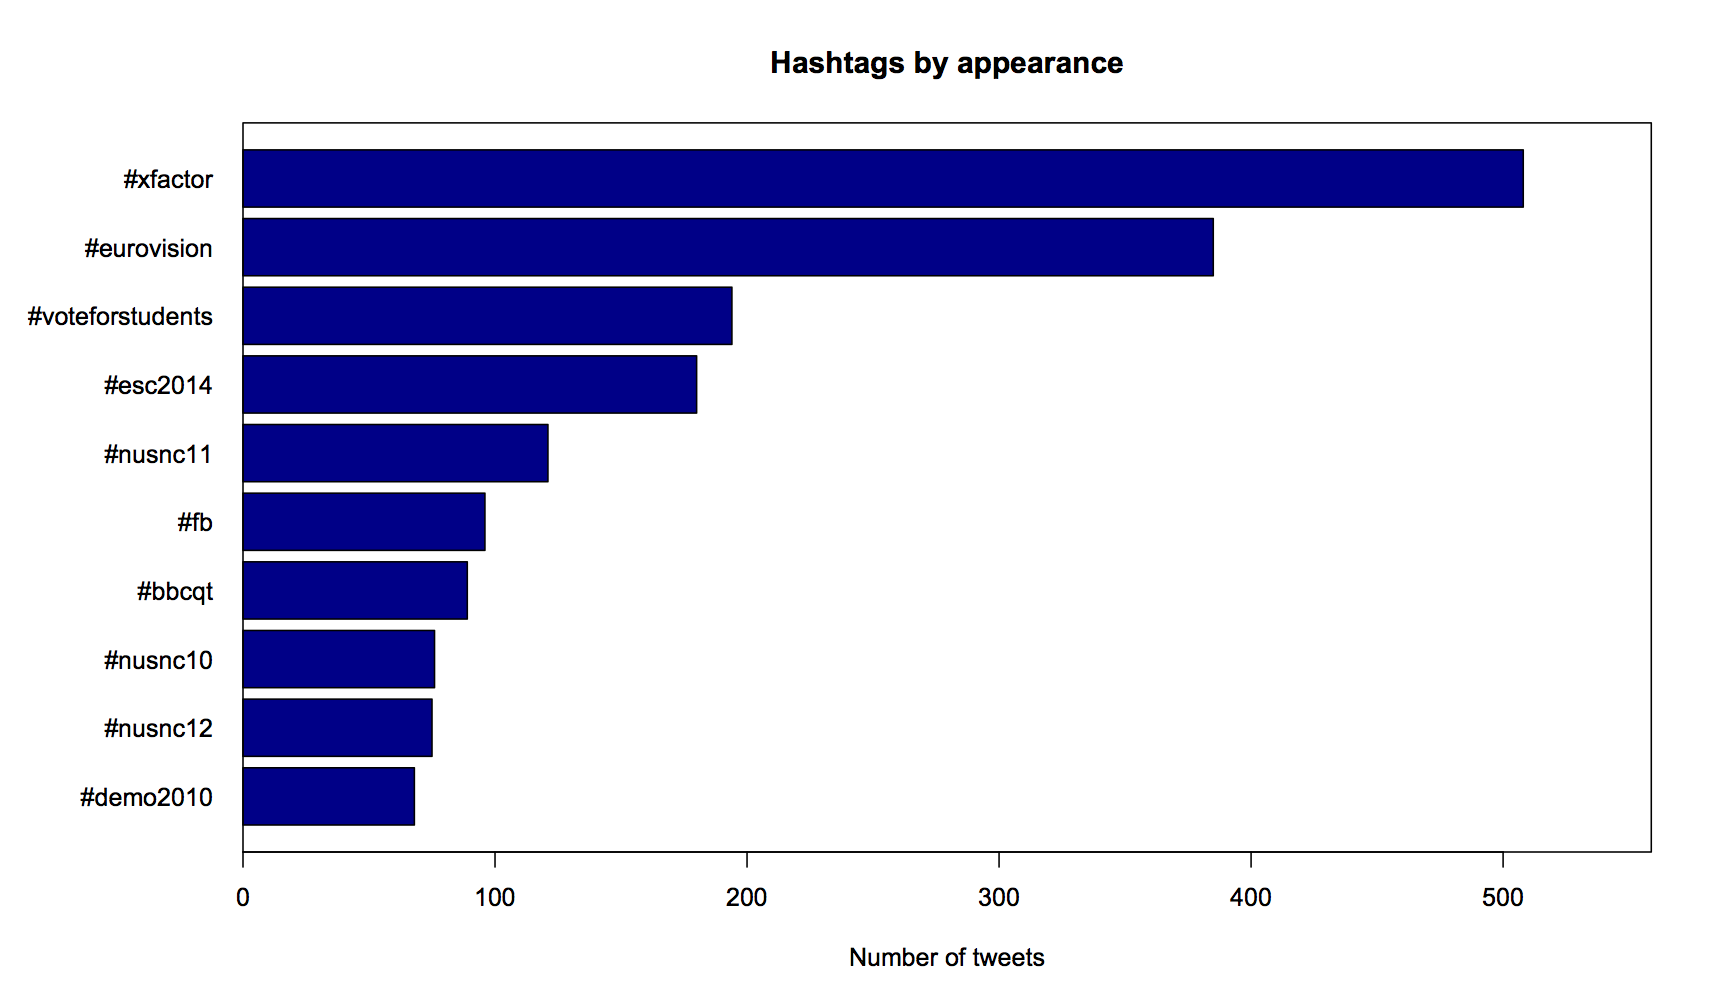
As will be apparent to anyone that knows me, most of my tweeting seems to be about either students or music. Quelle surprise.
Perhaps the most interesting thing here is that #xfactor and #eurovision are hashtags I have used for several years, but they have only just edged out over some time specific hashtags like #esc2014. This is perhaps symptomatic of my increasing enjoyment at live tweeting during TV shows and using ever more specific hashtags as a result.
Doing content analysis of Twitter archives is hard
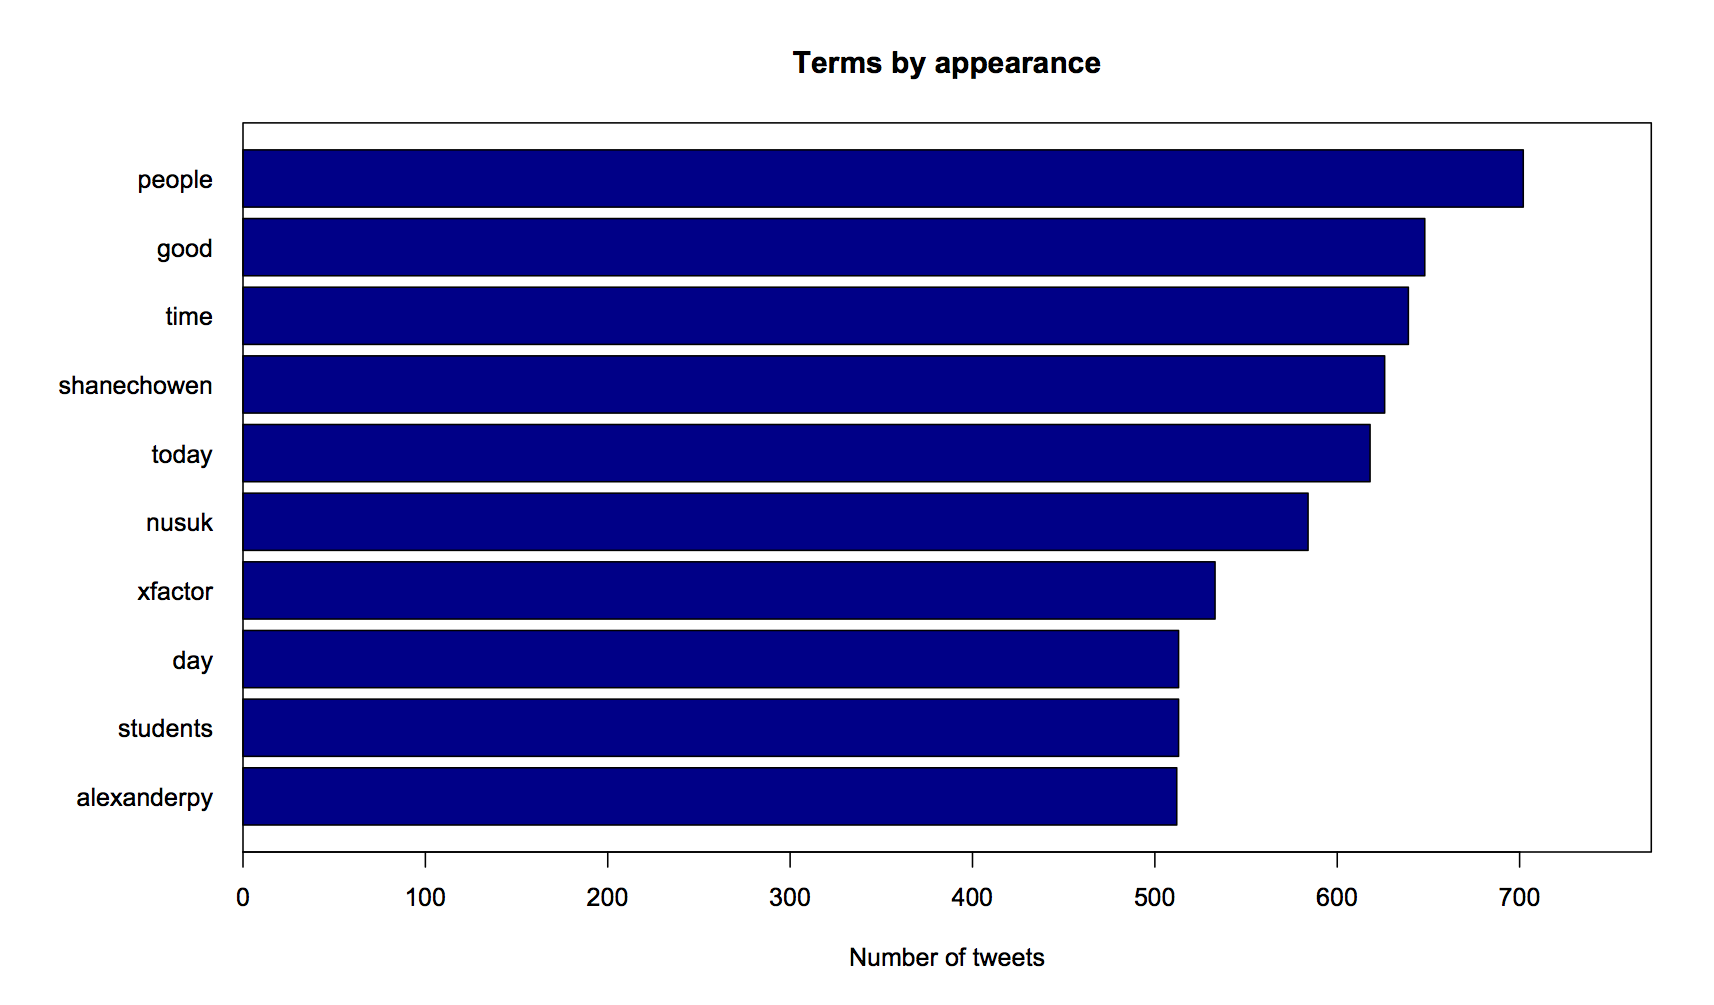
This graph is a little mis-leading, as it required a bit of data cleansing to remove all the ‘stop words’ from my tweets (like “I”, “there”, “that” and so on), so that the analysis only focussed on frequent words that were meaningful.
That caused me a few issues, because it meant I ended up truncating words like “you’ll” or “we’ve” to become “‘ll” and “‘ve”. Removing punctuation seemed like the only choice at this stage.
The result is that it took away the common symbols from the tweets that you’d normally want to exclude from an analysis such as this – specifically @ and #. As you can see, this left a bunch of hashtags and handles without their respective symbols, and has made this graph basically useless. Back to the drawing board on analysing what words I use the most in tweets!